
Turnilo - Interactive Data Exploration
Turnilo - Interactive Data Exploration
Turnilo is an open-source data exploration tool that lets you slice, filter, and visualize data through a drag-and-drop interface — no SQL required. It turns raw datasets into interactive explorations in seconds.
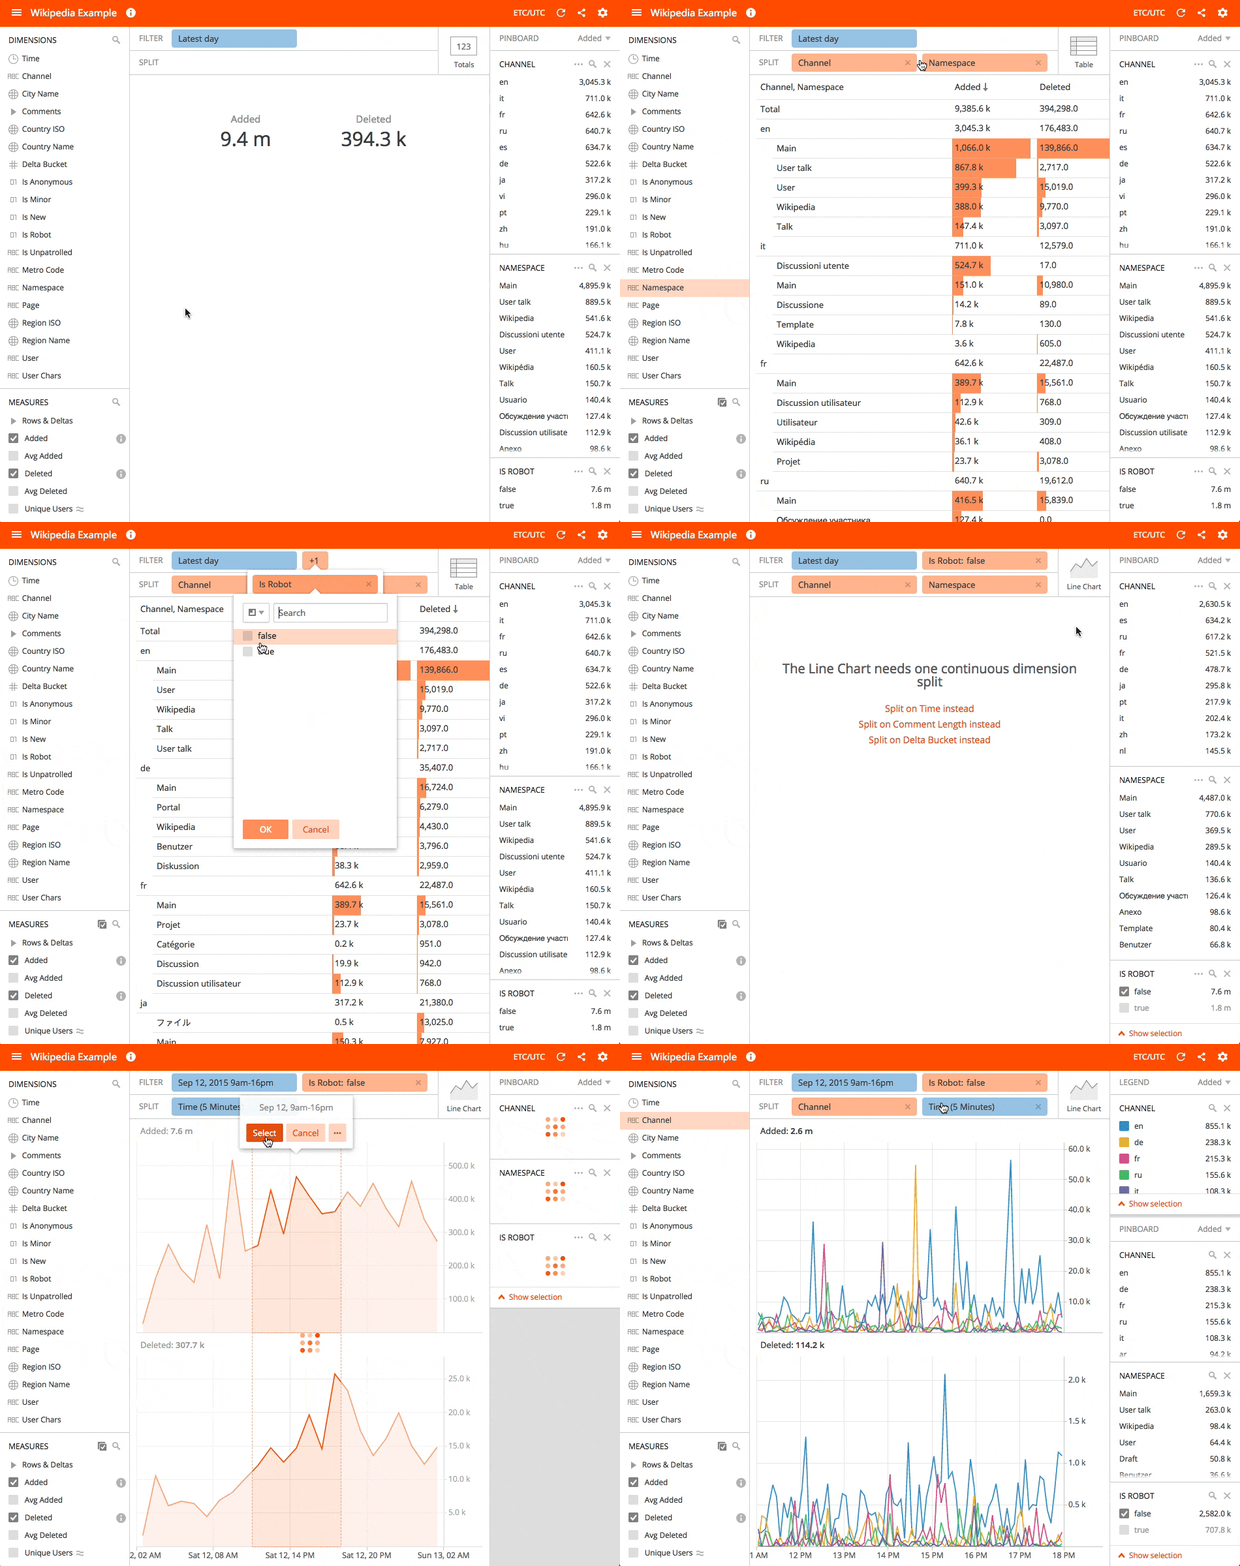
DataReporter embeds Turnilo to provide interactive exploration directly within your dashboards. Unlike standard visualizations which are query-result-driven, Turnilo lets users pivot, drill down, and explore data in real time without writing queries.
Key Features
- Drag-and-drop interface — Explore dimensions and measures without SQL
- Multiple visualization types — Bar charts, line charts, tables, totals, and heat maps
- Real-time filtering — Click to filter, split, and drill down into data
- Dashboard embedding — Turnilo widgets integrate natively into DataReporter dashboards
- Multi-backend support — Works with PostgreSQL, MySQL, BigQuery, Athena, Druid, and JSON data sources
- Ephemeral reports — Every exploration state is compressed into the URL — share a link, not a saved object
- Parameter mapping — Dashboard-level filters (e.g., date ranges) pass through to Turnilo widgets automatically
Visualization Types
Turnilo provides the following built-in visualization types:
Bar Chart
Displays categorical data as horizontal or vertical bars. Supports grouping, stacking, and sorting by any measure.
Line Chart
Time-series visualization with support for multiple measures, comparison periods, and trend analysis.
Table
Tabular display of dimension/measure combinations with sorting and pagination.
Totals
Single-number summary showing aggregated measure values with optional comparison to previous periods.
Heat Map
Two-dimensional visualization using color intensity to represent measure values across dimension intersections.
Supported Data Sources
Turnilo in DataReporter connects through the Plywood backend and supports:
| Data Source | Type | Notes |
|---|---|---|
| PostgreSQL | SQL | Full query support |
| MySQL | SQL | Full query support |
| Google BigQuery | Cloud SQL | Requires service account |
| AWS Athena | Cloud SQL | S3-based queries |
| Apache Druid | Native | Full introspection support |
| JSON | Custom | Static or API-driven data |
How It Works
- Plywood Backend — A dedicated service (port 3000) handles query translation and execution against your data sources
- Configuration Endpoint —
/config-turniloprovides data cube definitions, dimensions, and measures to the frontend - Dashboard Widgets — Turnilo visualizations embed in DataReporter dashboards as widgets with the
[turnilo-widget]marker - State Management — Each widget’s state (filters, splits, measures) is encoded as a hash in the widget configuration
Ephemeral Reports
Every Turnilo view is an ephemeral report. The full exploration state — visualization type, filters, splits, measures, time ranges, and sort order — is JSON-serialized, compressed, and encoded directly into the URL hash. The URL is the report.
This means:
- Share via link — Paste a Turnilo URL in Slack or email and your teammate opens the exact same view. No need to save a report first.
- Bookmark complex analyses — The browser bookmark preserves every detail of your exploration. Come back to it weeks later and it loads exactly as you left it.
- No report clutter — There are no saved report objects to name, organize, or clean up. Every view is self-contained in its URL.
- Programmatic generation — AI assistants and scripts can build report URLs without needing write access to the database. The MCP server’s
dr_build_turnilo_urltool does exactly this.
Traditional BI tools require you to save, name, and file every view before you can share it. With ephemeral reports, exploration and sharing are the same action — just copy the URL.
Getting Started
To use Turnilo in DataReporter:
- Ensure the Plywood service is running (included in the standard Docker deployment)
- Navigate to any dashboard
- Add a new Turnilo widget
- Select your data cube, dimensions, and measures
- Explore your data interactively
For datacube configuration (dimensions, measures, and Plywood expressions), see Datacube Configuration.